


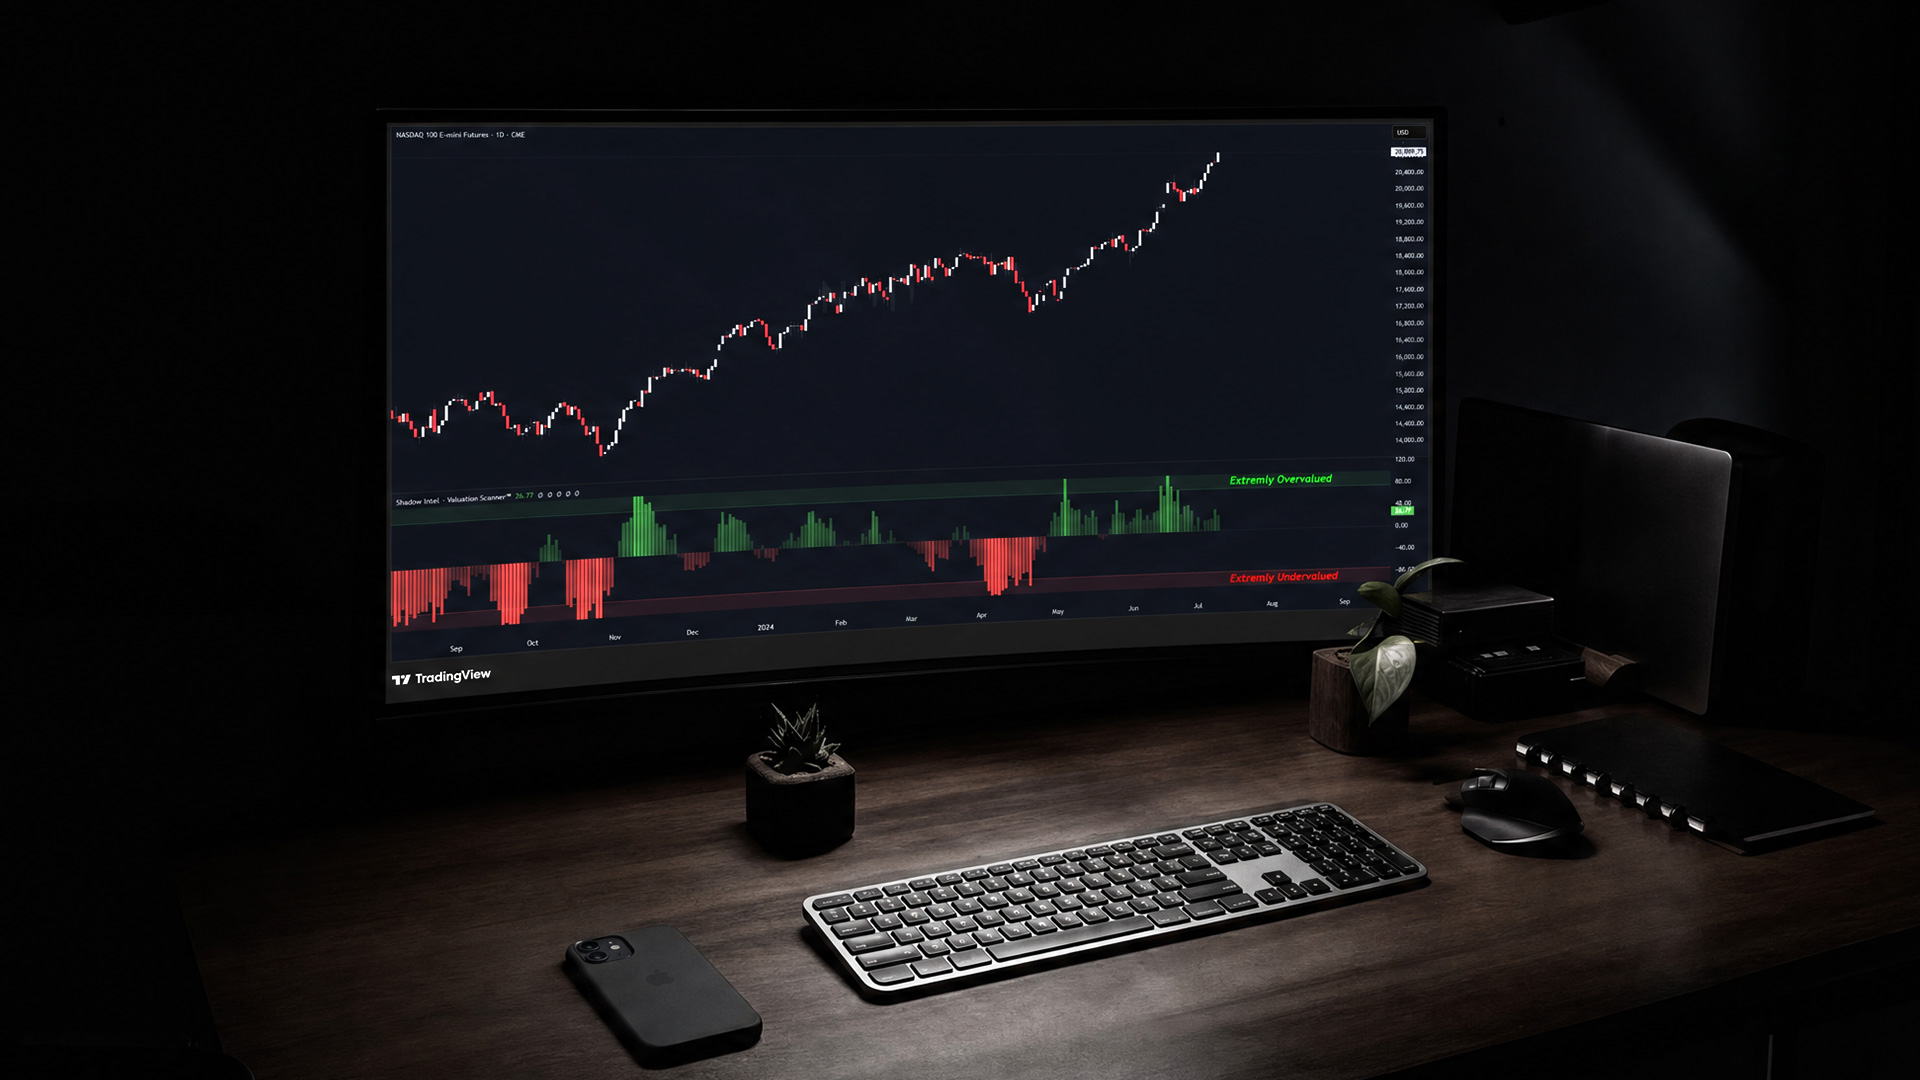
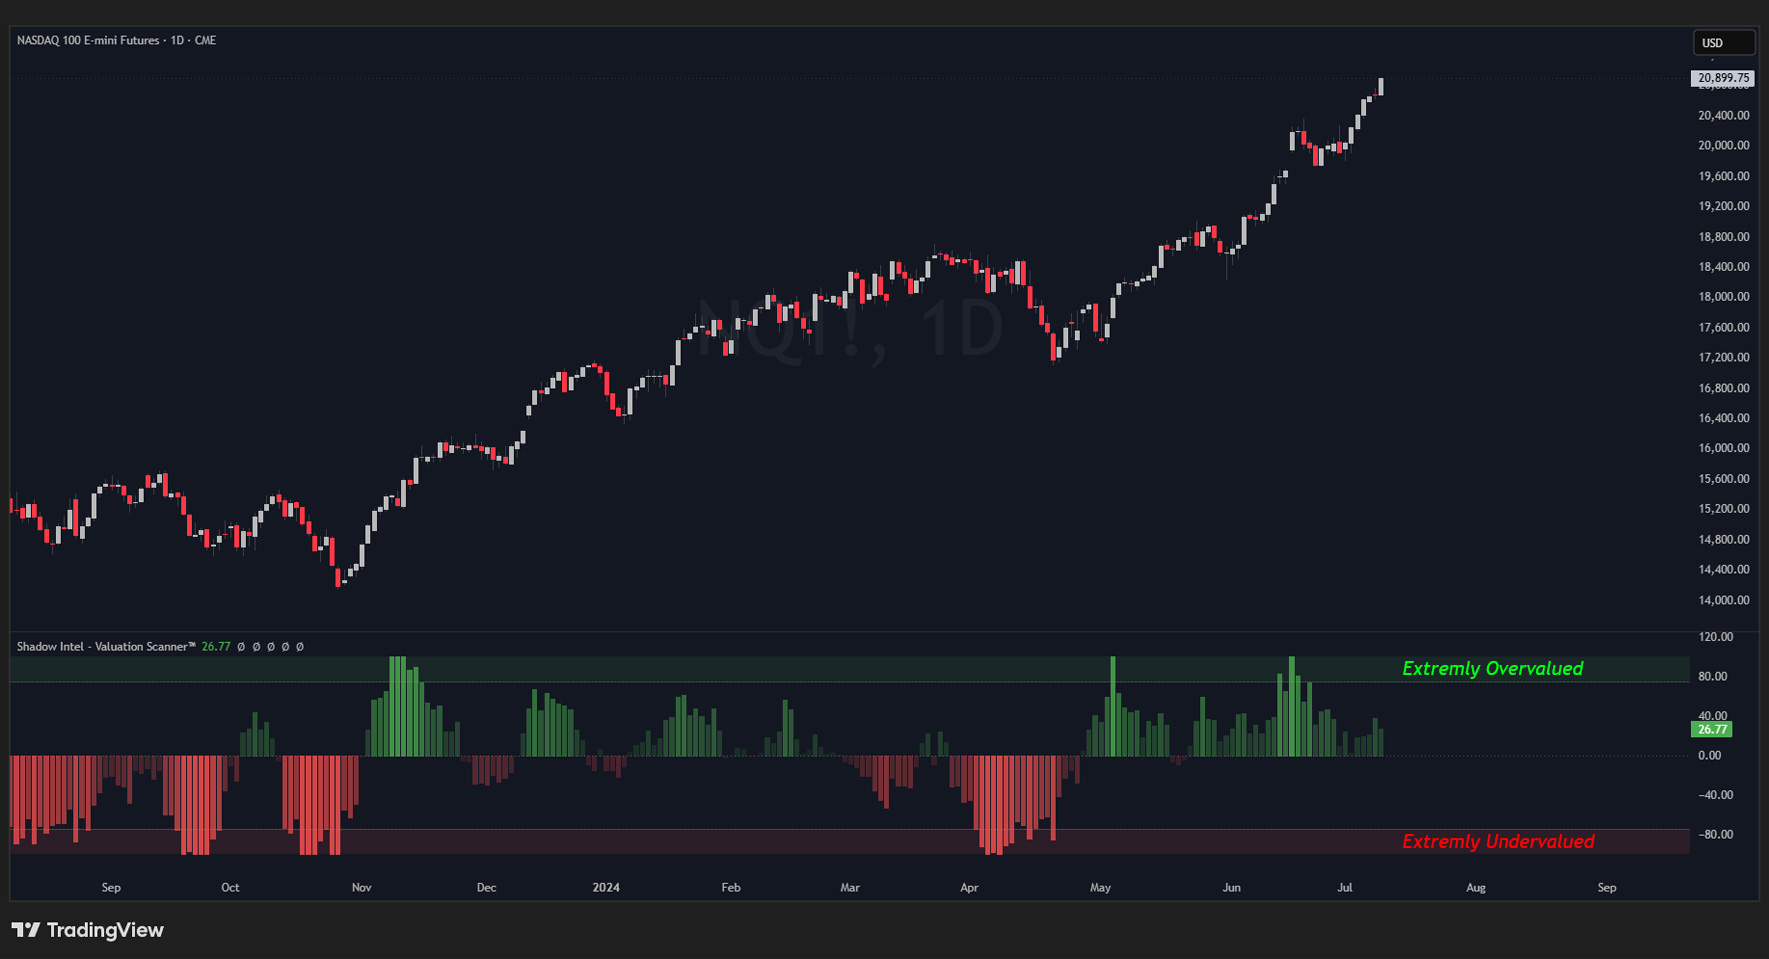
Shadow Intel — Valuation Scanner™
The Valuation Scanner™ compares every asset against its correlated driver to reveal exactly when price is genuinely undervalued or overvalued — so you can trade with an asymmetric edge.
// What It Does
The Valuation Scanner™ answers one simple question before every trade, “is this asset cheap or expensive compared to what drives it?”
Every asset in the market has a driver — a correlated asset it naturally moves with. This tool measures how far price has stretched from that relationship and signals when it has gone too far.
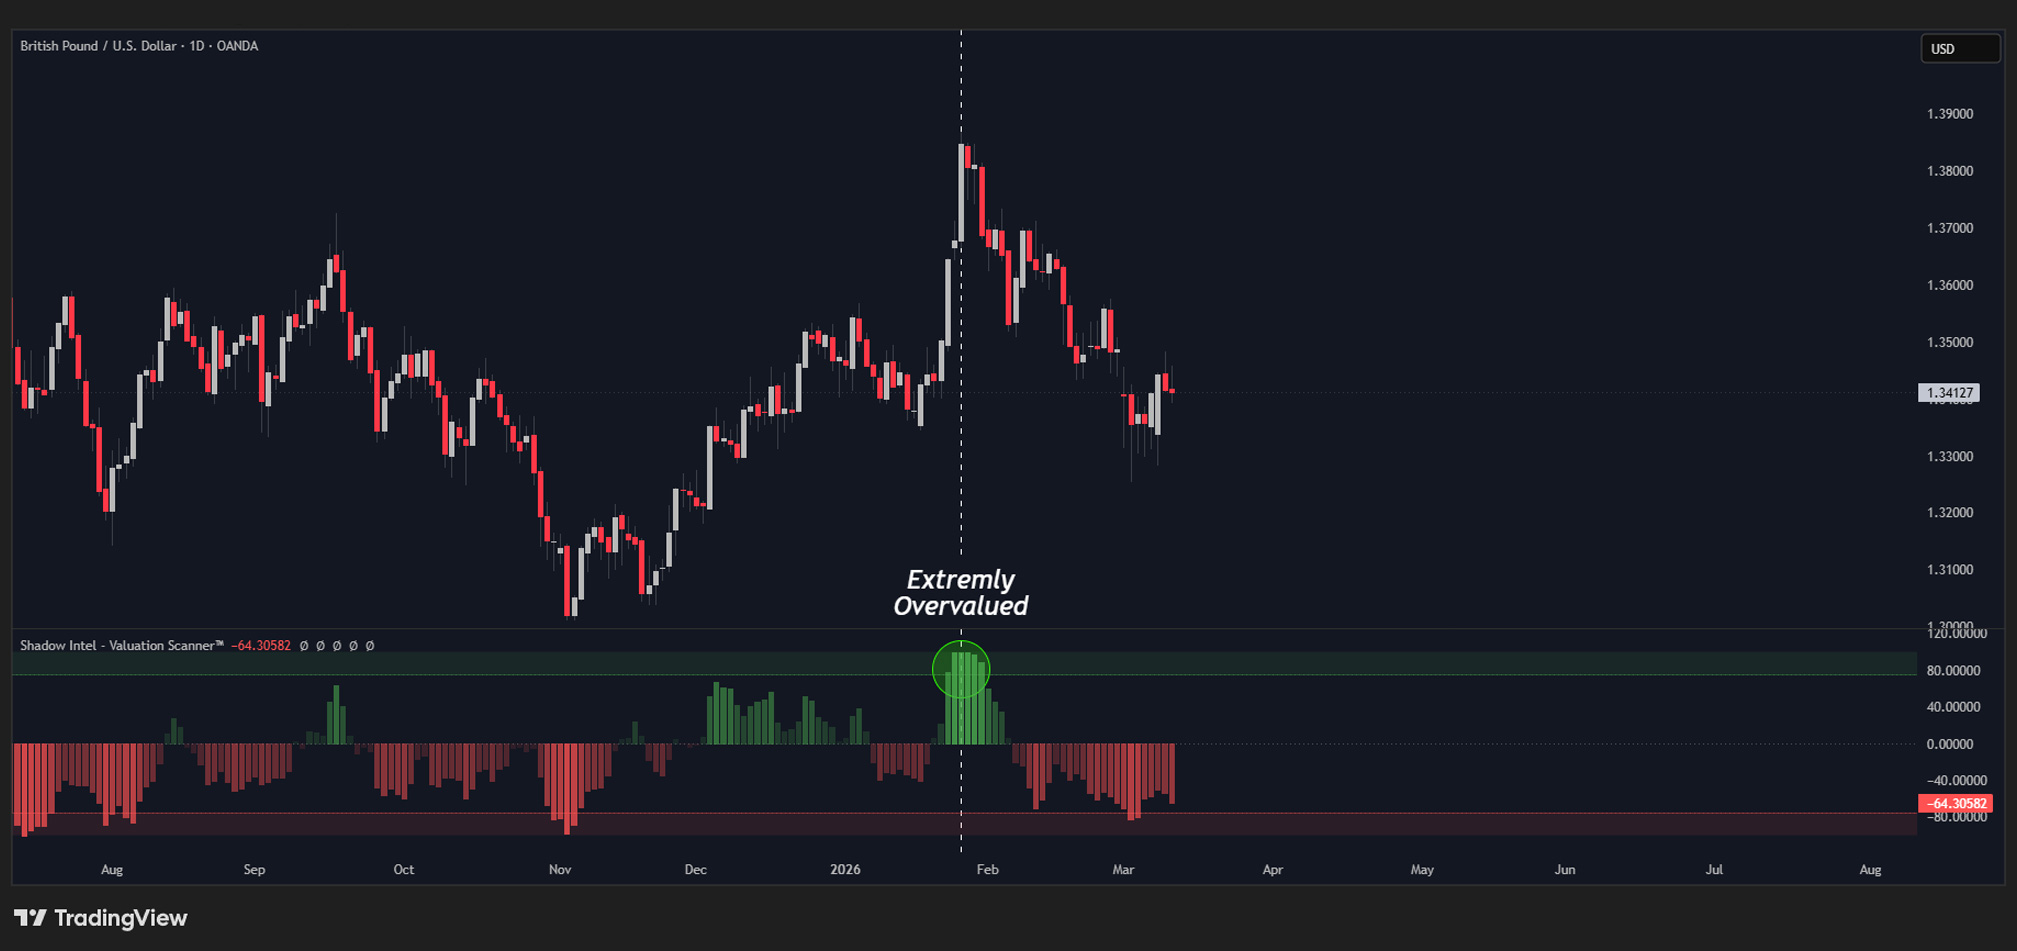
When price stretches too far above its driver, the asset is overvalued. Smart money sells.
When price stretches too far below its driver, the asset is undervalued. Smart money buys.
This is not like the RSI. It measures something RSI cannot.
// What to Compare Against
Every asset has a dominant driver. Use the largest, most influential asset in that category.
Forex (EUR, GBP, JPY) — US Dollar
Commodities (Gold) — US Dollar
Commodities (Silver, Copper) — Gold / US Dollar
Energy (Oil) — Gold / US Dollar
Energy (Natural Gas) — Oil or US Dollar
Indices (S&P 500, Nasdaq) — Bonds / US Dollar
Bonds (ZB, TLT) — US Dollar
Quick tip: The US Dollar can always be used as a comparison, regardless of the asset category.
// Settings
All defaults have been tested across multiple markets and timeframes. No changes are required to get started.
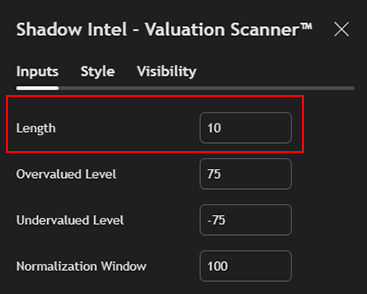
Length — Default: 10 How many candles the indicator looks back to calculate its average. Lower = faster and more reactive. Higher = slower and smoother.
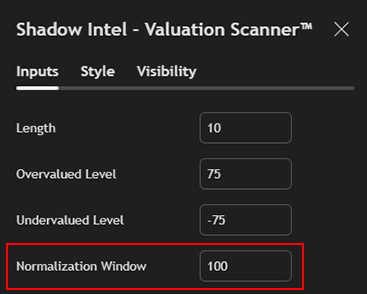
Normalization Window — Default: 50–100 Controls how dramatically the line swings toward the extremes. Lower = more dramatic. Higher = calmer. Start with the default and adjust after backtesting.
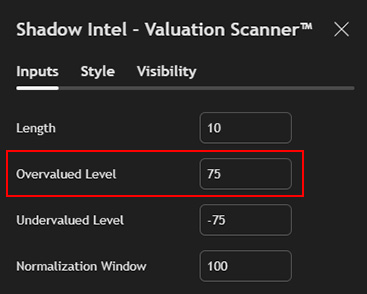
Overvalued Level — Default: +75 When the line crosses above this level, the asset is considered overvalued. This is where smart money looks to sell.
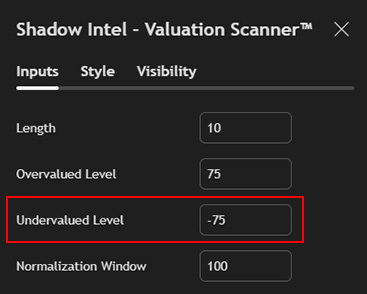
Undervalued Level — Default: −75 When the line crosses below this level, the asset is considered undervalued. This is where smart money looks to buy.
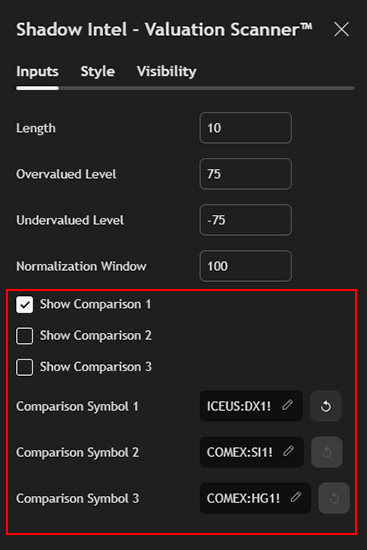
Comparison Symbols — Up to 3 Compare against up to three assets simultaneously. Always use futures tickers, not CFD tickers. But you can directly leverage this to trade on CFDs as we do in our community. These tools are for your bias and directly correlates to your CFD charts.
// Display Options
Heatmap — Colors the indicator based on how extreme the reading is. Subtle near zero, more intense at the extremes. Visual only — does not affect calculations.
Line Overlay — Shows the line without the heatmap for a cleaner look.
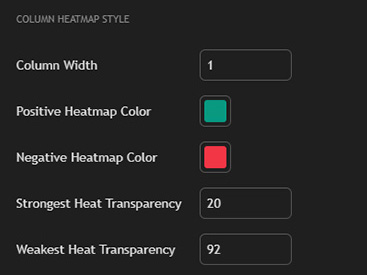
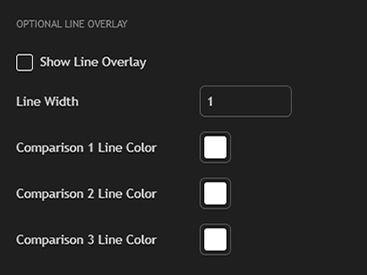
Levels, zones, colors, line thickness, and zone appearance can all be customized to preference.
// How to Use It
The Valuation Scanner™ is a confirmation tool. Use it alongside your existing analysis — key levels, supply and demand zones, and trade setups — to answer one additional question before entering a trade:
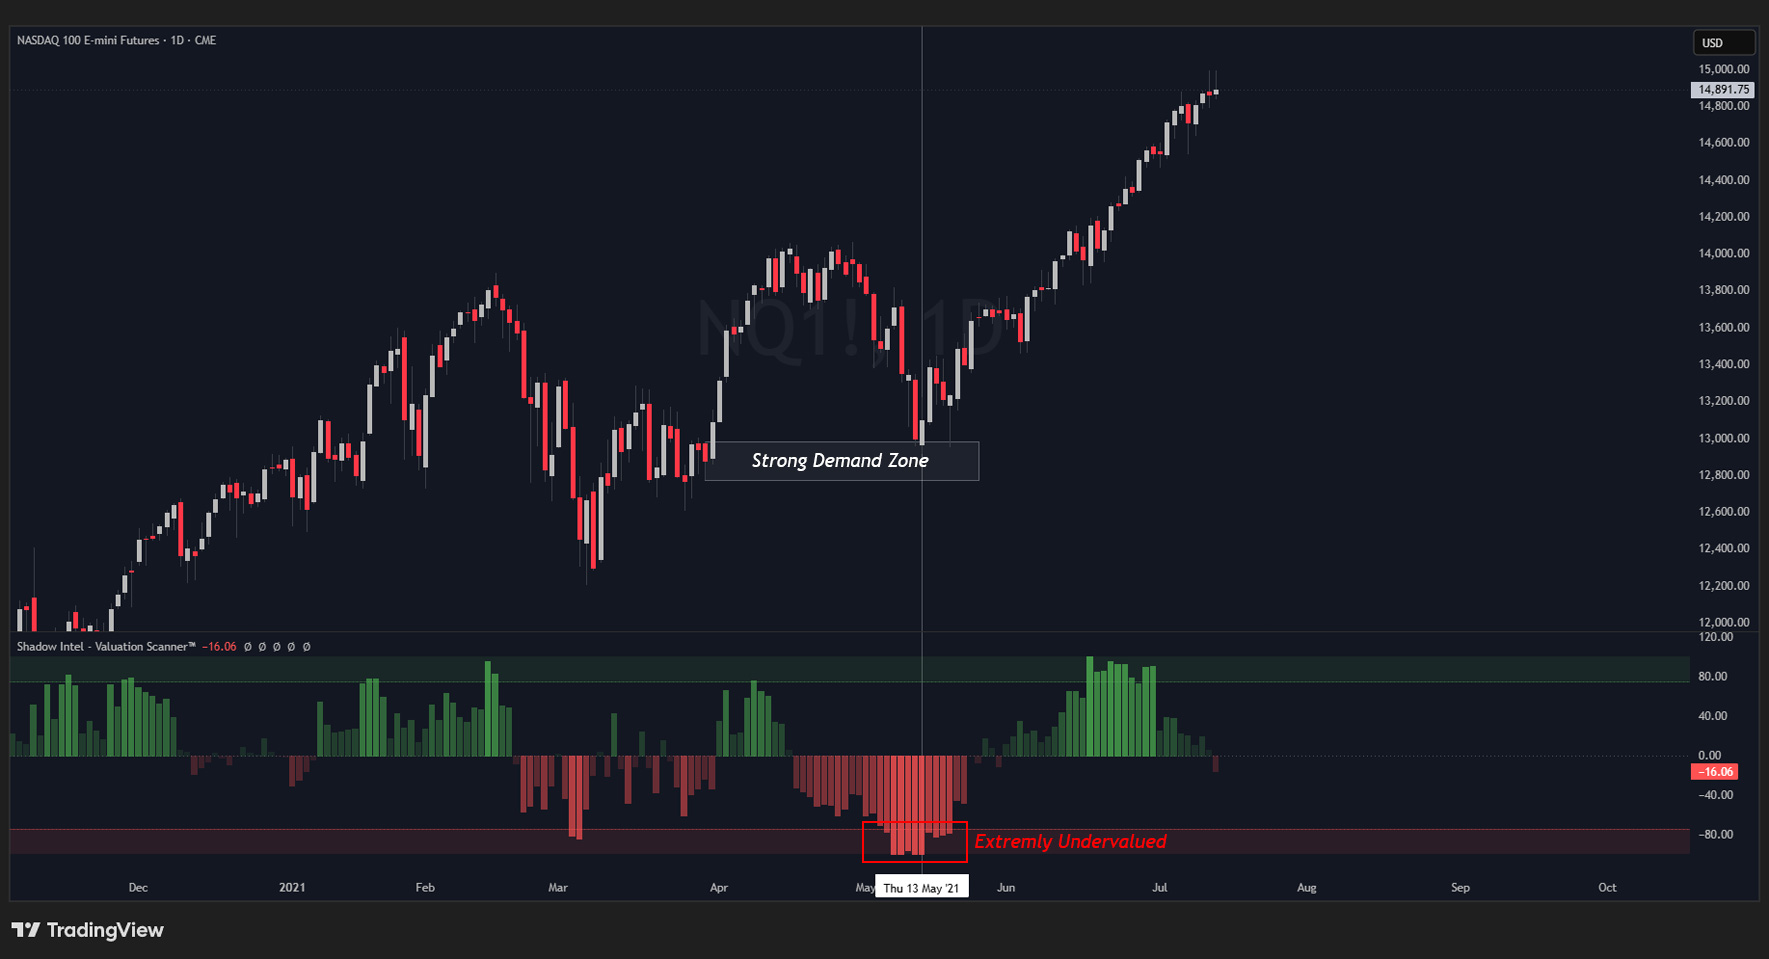
Am I buying when this is cheap, or am I buying when it is already expensive?
The most powerful signals appear on the Daily and Weekly timeframes, particularly at major reversal points where price has stretched significantly from its driver.
But this indicator works brilliantly on the 5 and 15 minute time frame as well.
// The Bigger Picture
Price does not move randomly. Every asset is connected to something else, and large institutional players always seek to buy cheap and sell expensive.
The Valuation Scanner™ makes this visible. An asset can be at all-time highs and still be undervalued. An asset can be falling sharply and still be overvalued. The price alone does not tell the full story.
When a major news cycle drives retail traders into an asset at extreme levels, that is often institutional money exiting overvalued positions — using retail as exit liquidity. This tool helps you identify which side of that flow you are on, so you can trade with the institutions rather than against them.
For information on how to access this Shadow Intel Stack:
Message our support in telegram.
// FAQ
