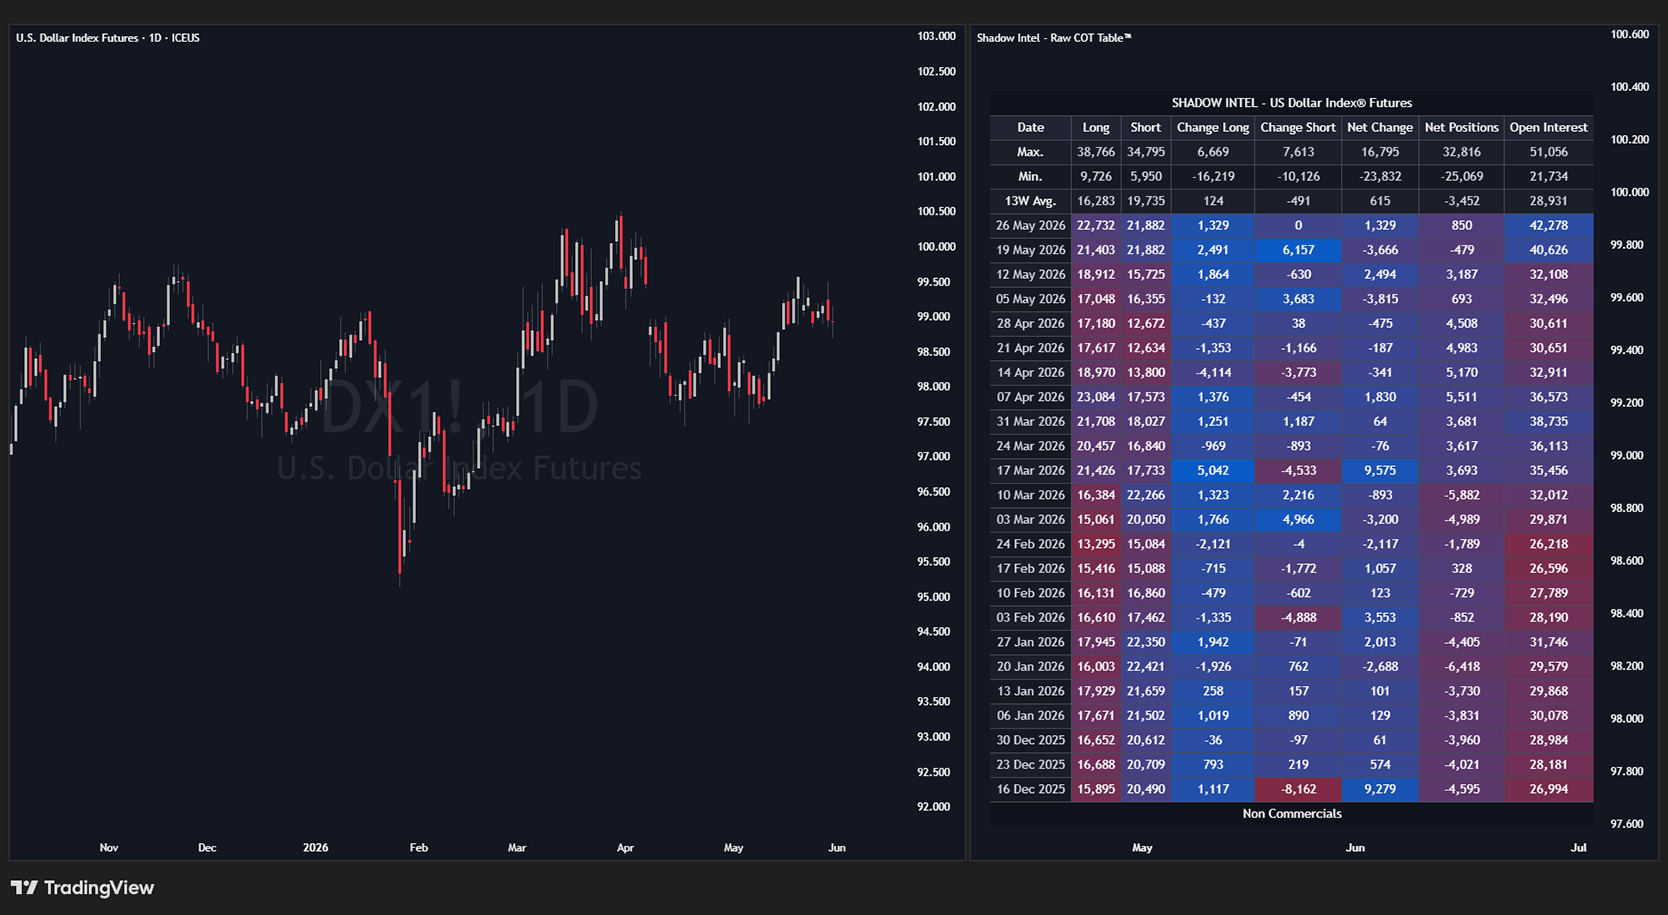
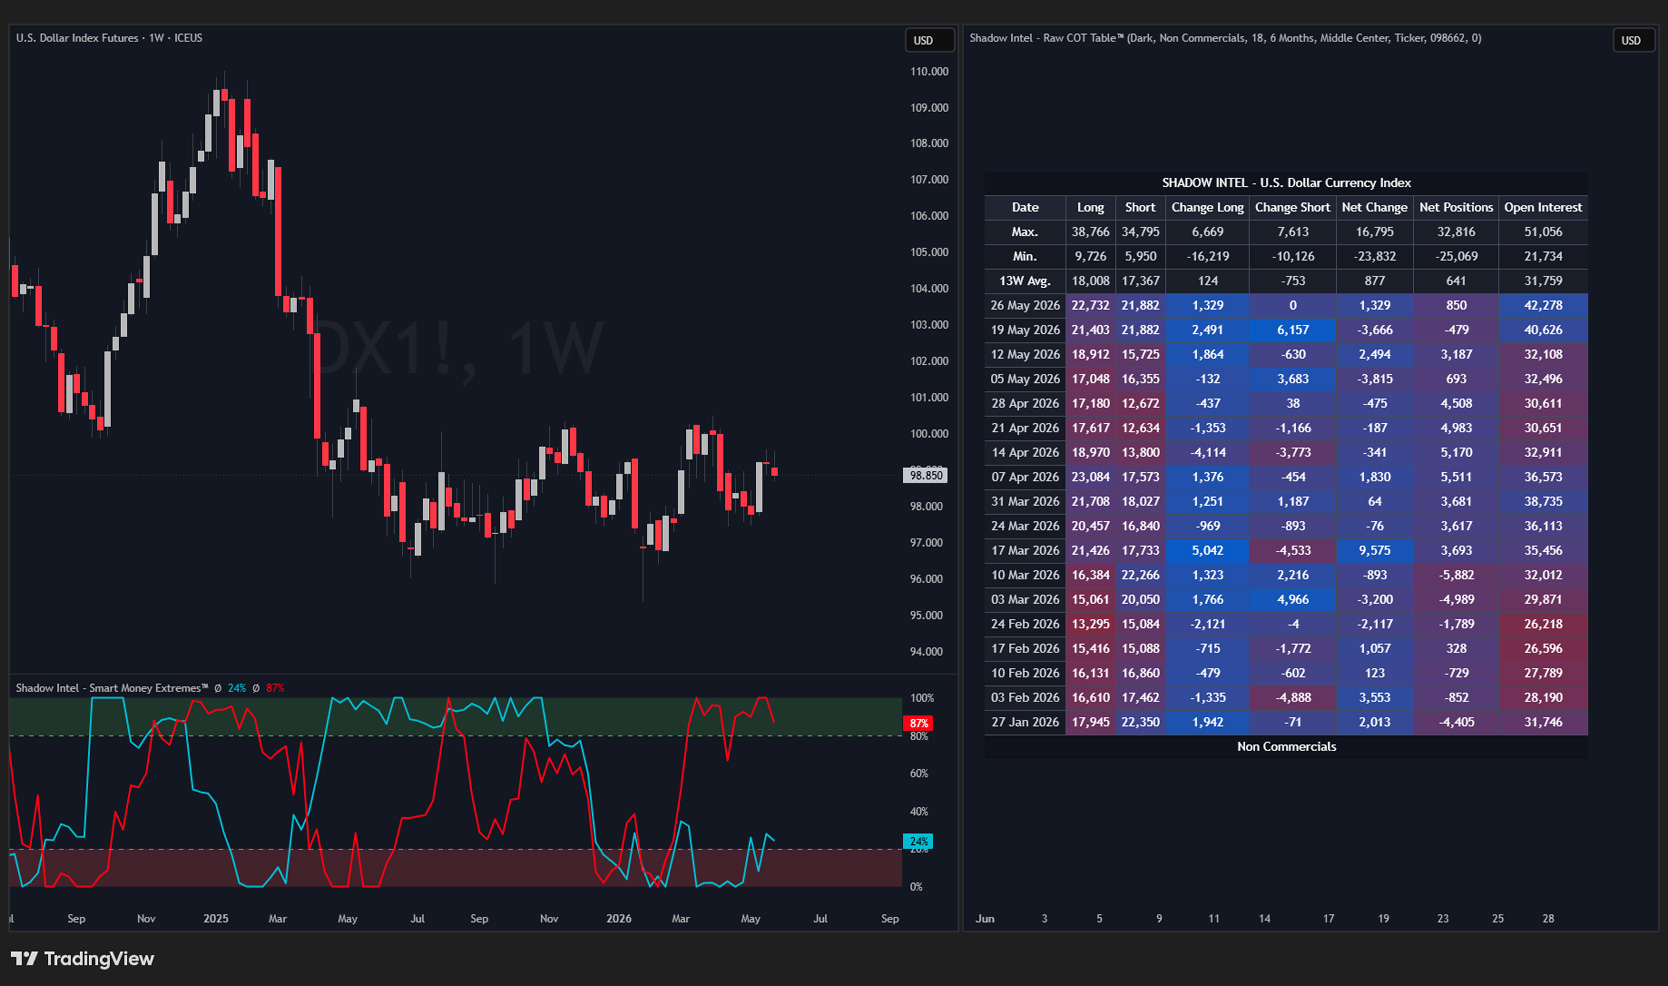
The Raw COT Table™ puts the full Commitments of Traders report directly on your chart. Displayed perfectly and ready to read without ever opening a PDF.
COT stands for Commitments of Traders. Every week, the largest market participants are required to report exactly how they are positioned. The CFTC releases that data every Friday.
Most traders never read it. Shadow Intel — Raw COT Table™ puts it directly on your chart as a clean, structured table so you can see it at a glance.
Important: This is not a timing tool. It does not tell you when to enter a trade. It helps you see what the big money is doing before price tells you.
// Reading the Table
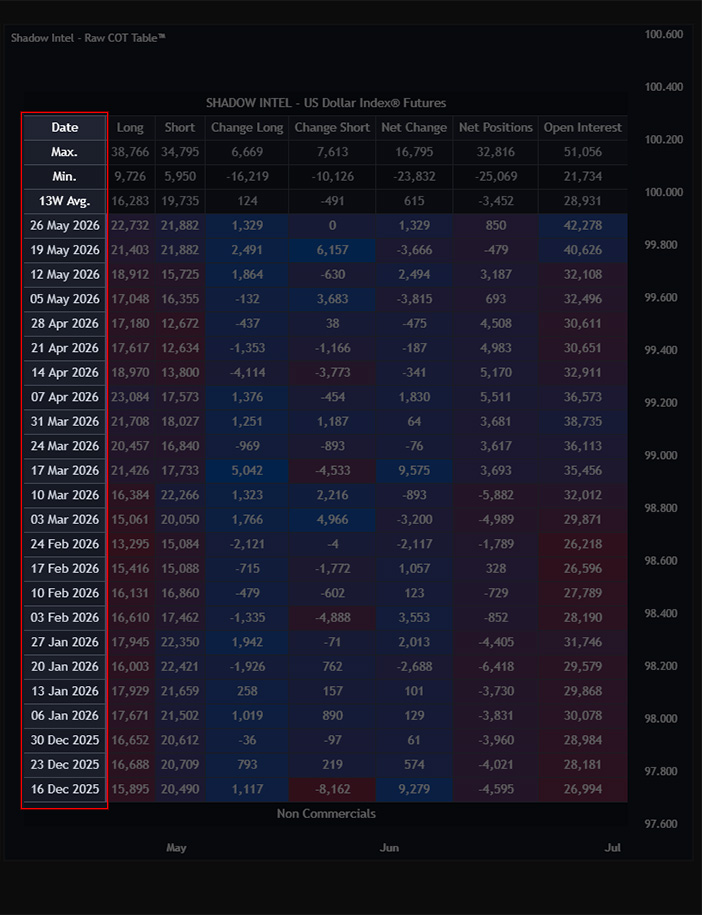
Date Smart money reports their positioning every Tuesday. The COT report is then released on Friday. The date column reflects the Tuesday reporting date.
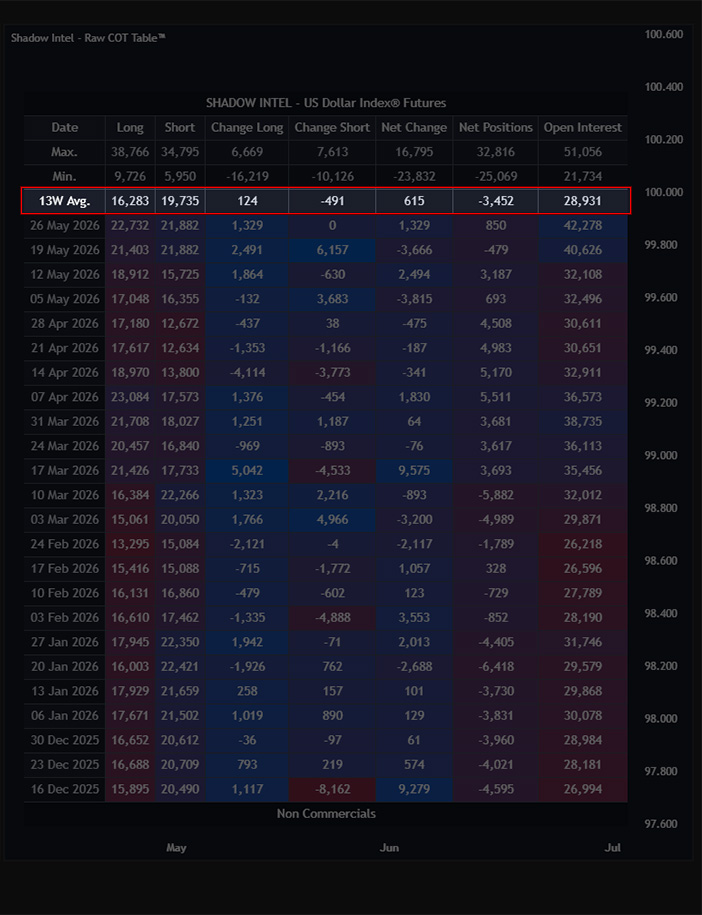
13W Average The average of the last 13 weeks — roughly one quarter of data. This gives you a baseline for what is normal for each group, so you can instantly tell when the current week is running above or below their recent behaviour.
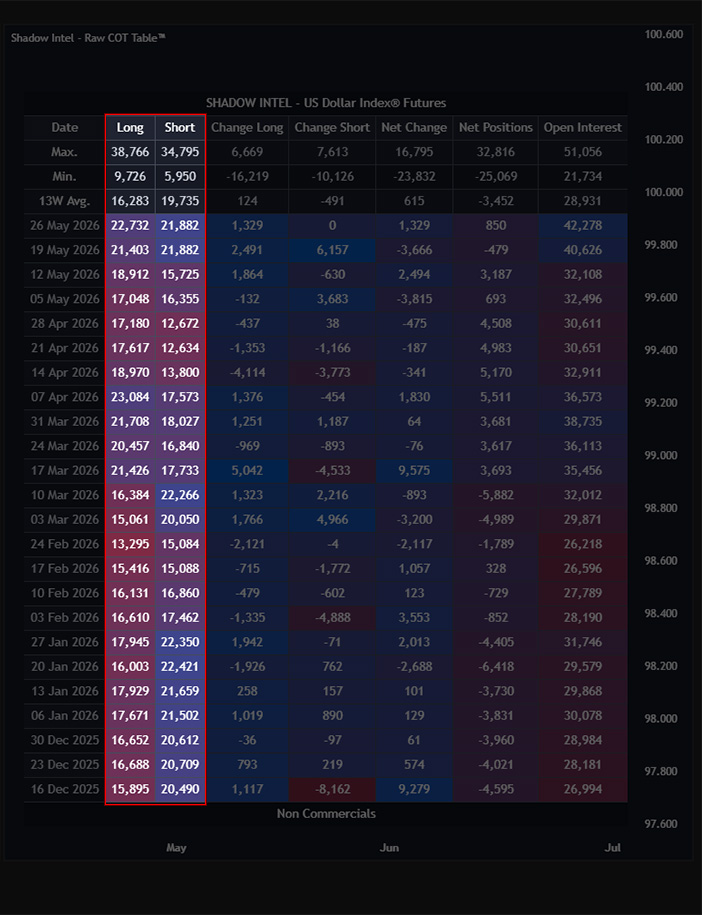
Long / Short The current number of Long and Short contracts held by each group.
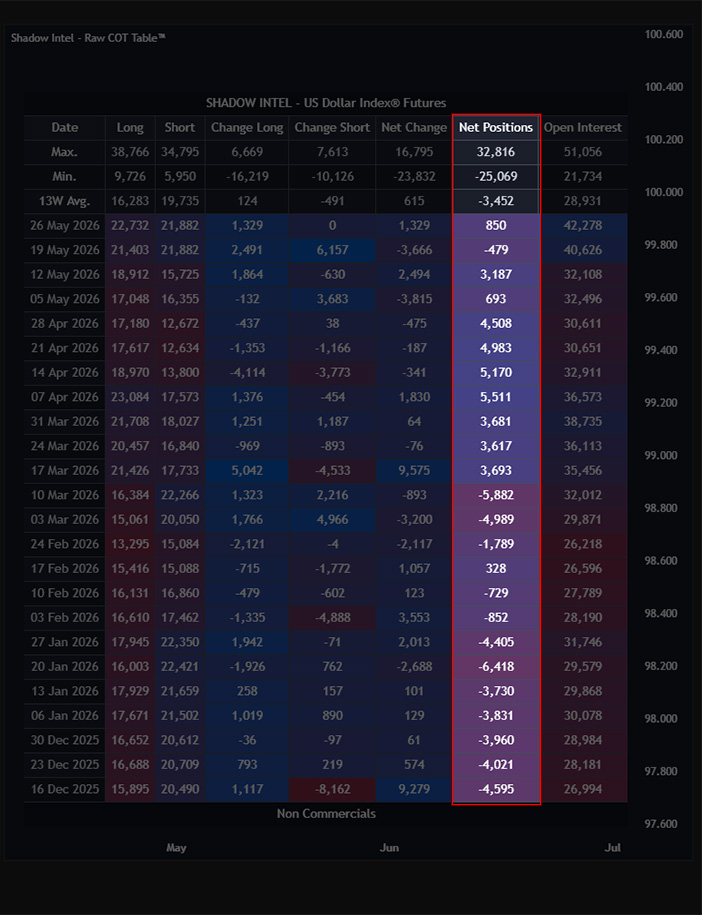
Net Position Long contracts − Short contracts = Net position. These are one of the most important numbers in the table. It tells you which side each group is truly leaning toward after netting everything out.
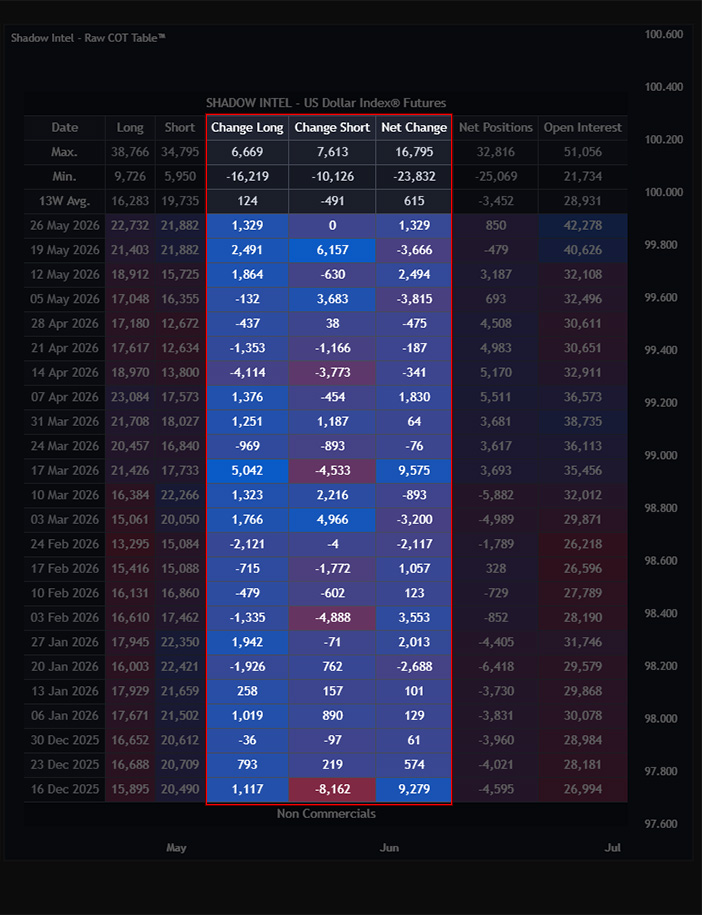
Change Columns The week-over-week change in Long contracts, Short contracts, and Net position. This shows you whether positioning is building, unwinding, or shifting direction.
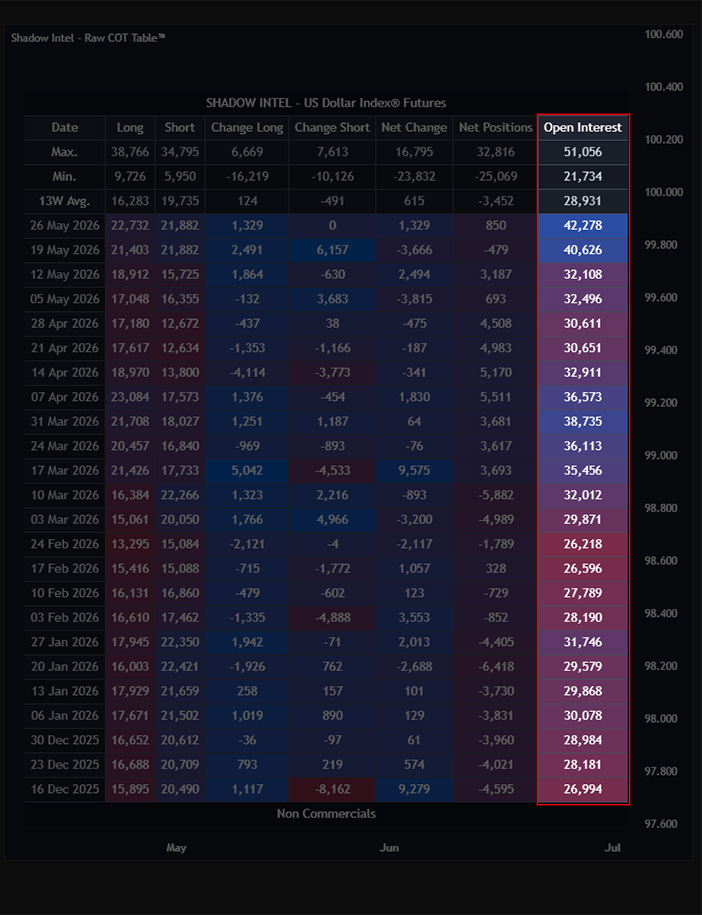
Open Interest The total number of active contracts across all participants in the market. Rising Open Interest means money is flowing in. Falling Open Interest means participants are leaving.
// Settings
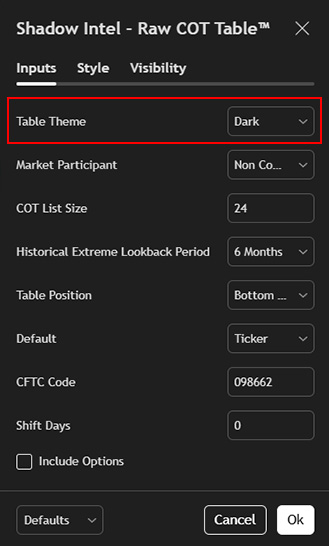
Table Theme Switch between Dark and Light to match your chart layout.
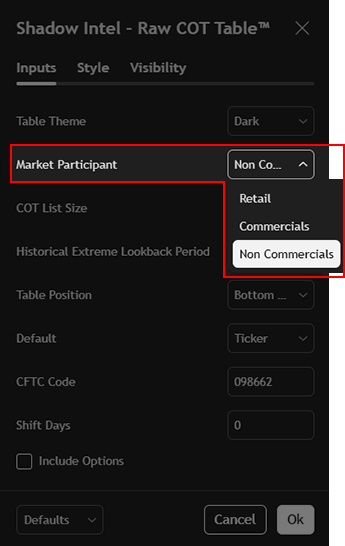
Market Participant — Default: Non-Commercials Select which group the table displays by default — Commercials, Non-Commercials, or Retail.
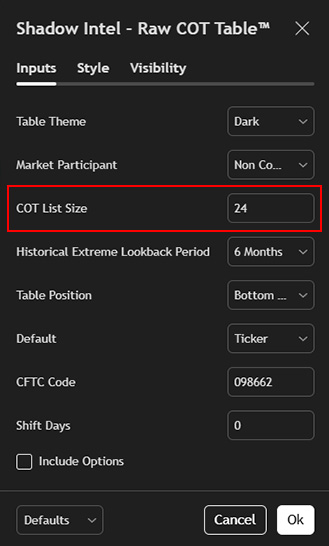
COT List Size — Default: 26 How many weeks of data are shown in the table. 26 weeks covers half a year.
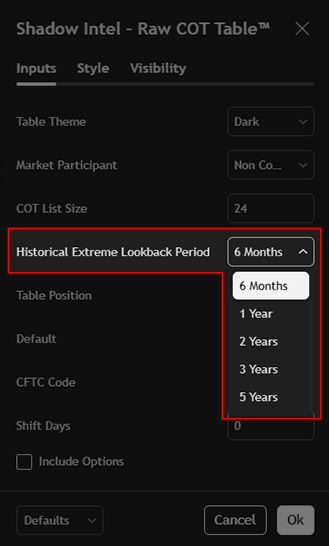
Historical Extreme Lookback Period — Default: 6 Months The period used to identify and highlight historical extremes within the table. Cells that reach an extreme within this window are highlighted automatically.
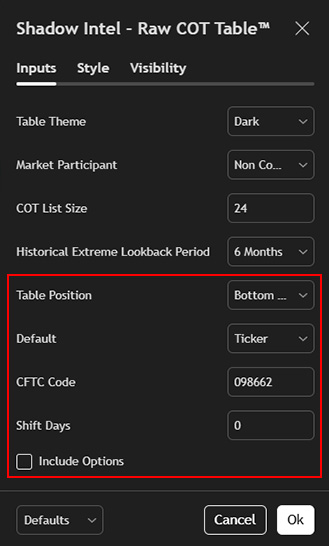
Table Position Controls where the table sits on your chart. Adjustable to Bottom or other positions depending on your layout preference.
Default — Default: Ticker Determines how the indicator loads by default — by Ticker or by CFTC Code.
CFTC Code Allows you to manually enter a specific CFTC code to pull data for any instrument directly.
Shift Days — Default: 0 Shifts the table data forward or backward by a set number of days. Leave at 0 unless you have a specific reason to adjust.
Include Options — Default: Off Adds options data on top of futures positioning for a broader view of total market exposure.
Important: Use this indicator on the Daily or Weekly timeframe only. Always pair it with a Futures ticker, not a CFD, to ensure the correct data is displayed.
// The Bigger Picture
The COT report has always been public. The problem was never the access — it was readability.
Shadow Intel — Raw COT Table™ solves that. The data is on your chart, formatted, and updated every week. Pair it with COT Net Positions™ and Smart Money Extremes™ and you have the complete picture of who is positioned where, how stretched they are, and what is likely coming next.
Most retail traders never see any of this. Now you do.
For information on how to access this Shadow Intel Stack: