COT Net Positions™ displays the actual net positioning of every major market participant directly on your chart — across more than 20 years of history. See exactly where the big money is sitting right now, relative to where it has always been.
// What It Does
If you have already watched the Shadow Intel — Raw COT Table™ tutorial, you know what COT data is. This indicator takes that same data one step further.
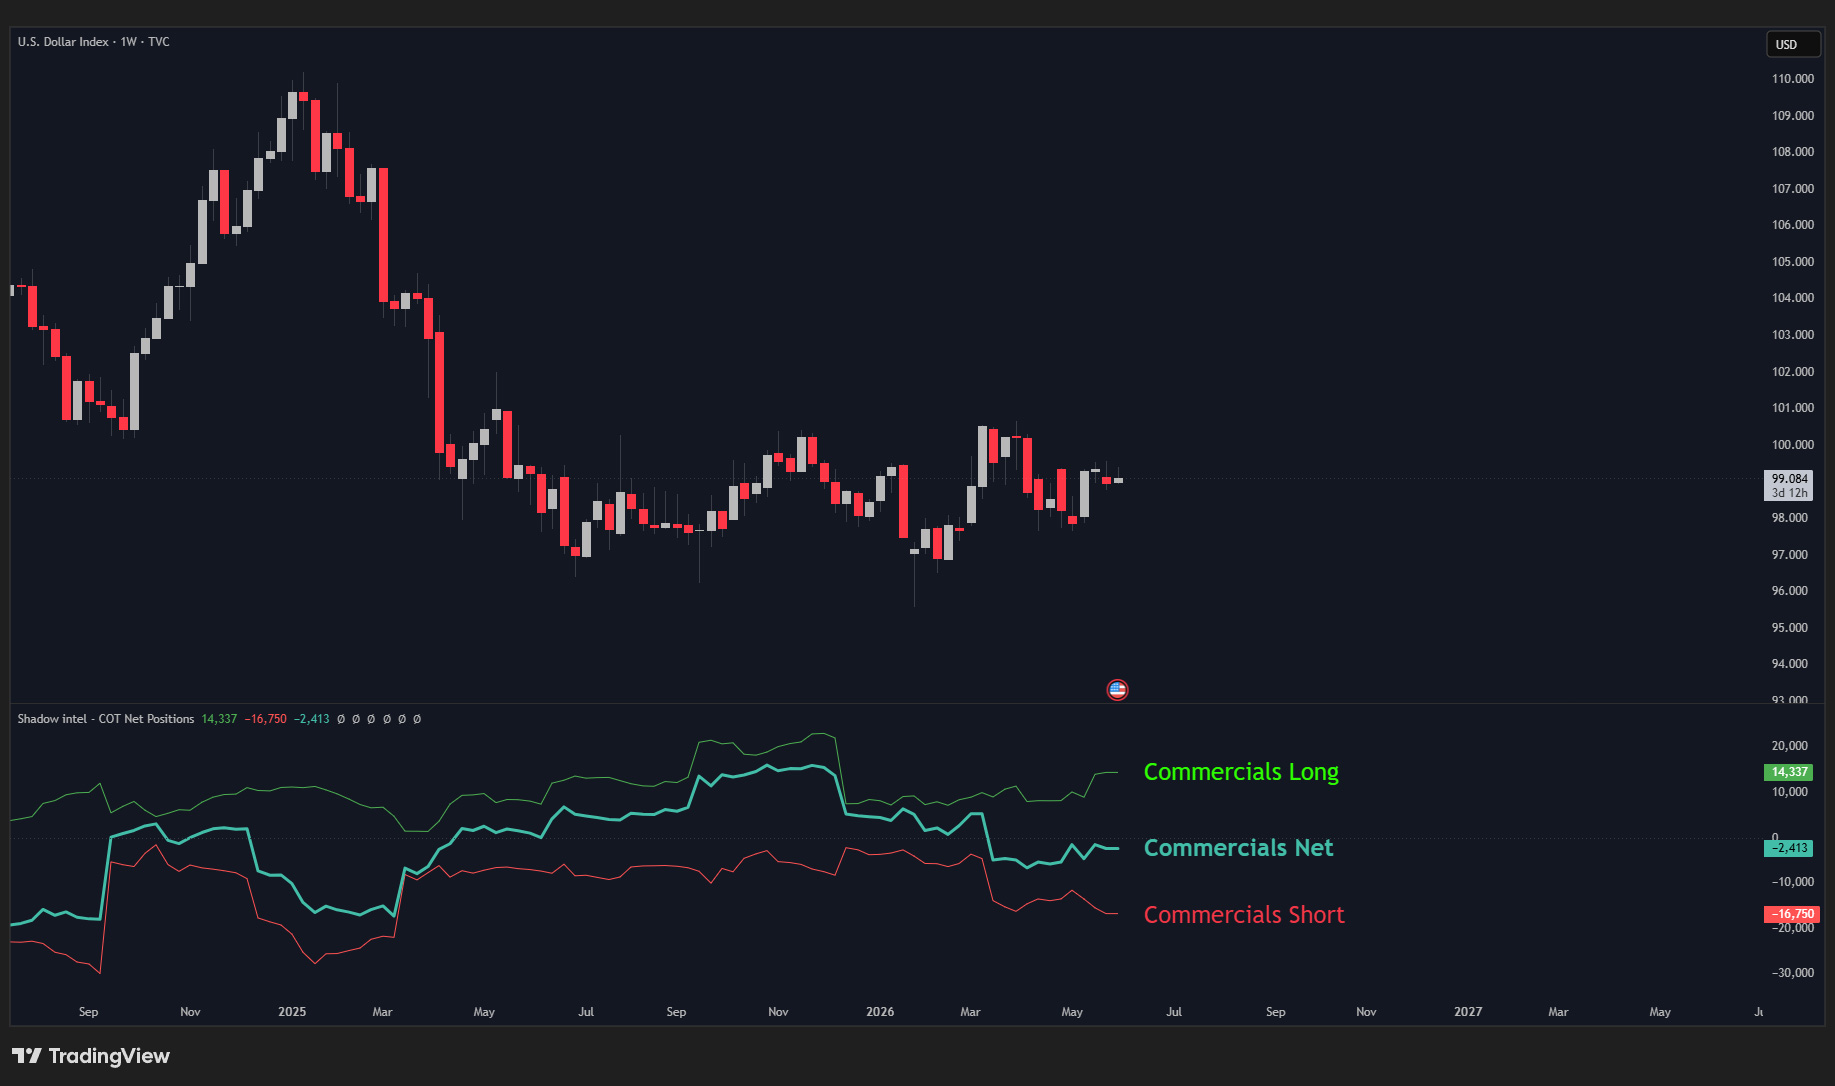
Instead of raw numbers, you get the net position of each participant displayed as lines directly on your chart.
Long contracts − Short contracts = Net position.
This is the most important thing the indicator shows you. It also displays the individual Longs and Shorts lines separately, which matter for reasons covered in the examples below.
The data goes back over 20 years. That is what makes it powerful — you are not just looking at where positioning is today, you are seeing where it sits relative to its entire historical behaviour.
// The 3 Market Participants
Commercials The producers and hedgers. They use futures to protect their business, not to speculate. They almost always position against the trend — and history shows they are right most of the time.
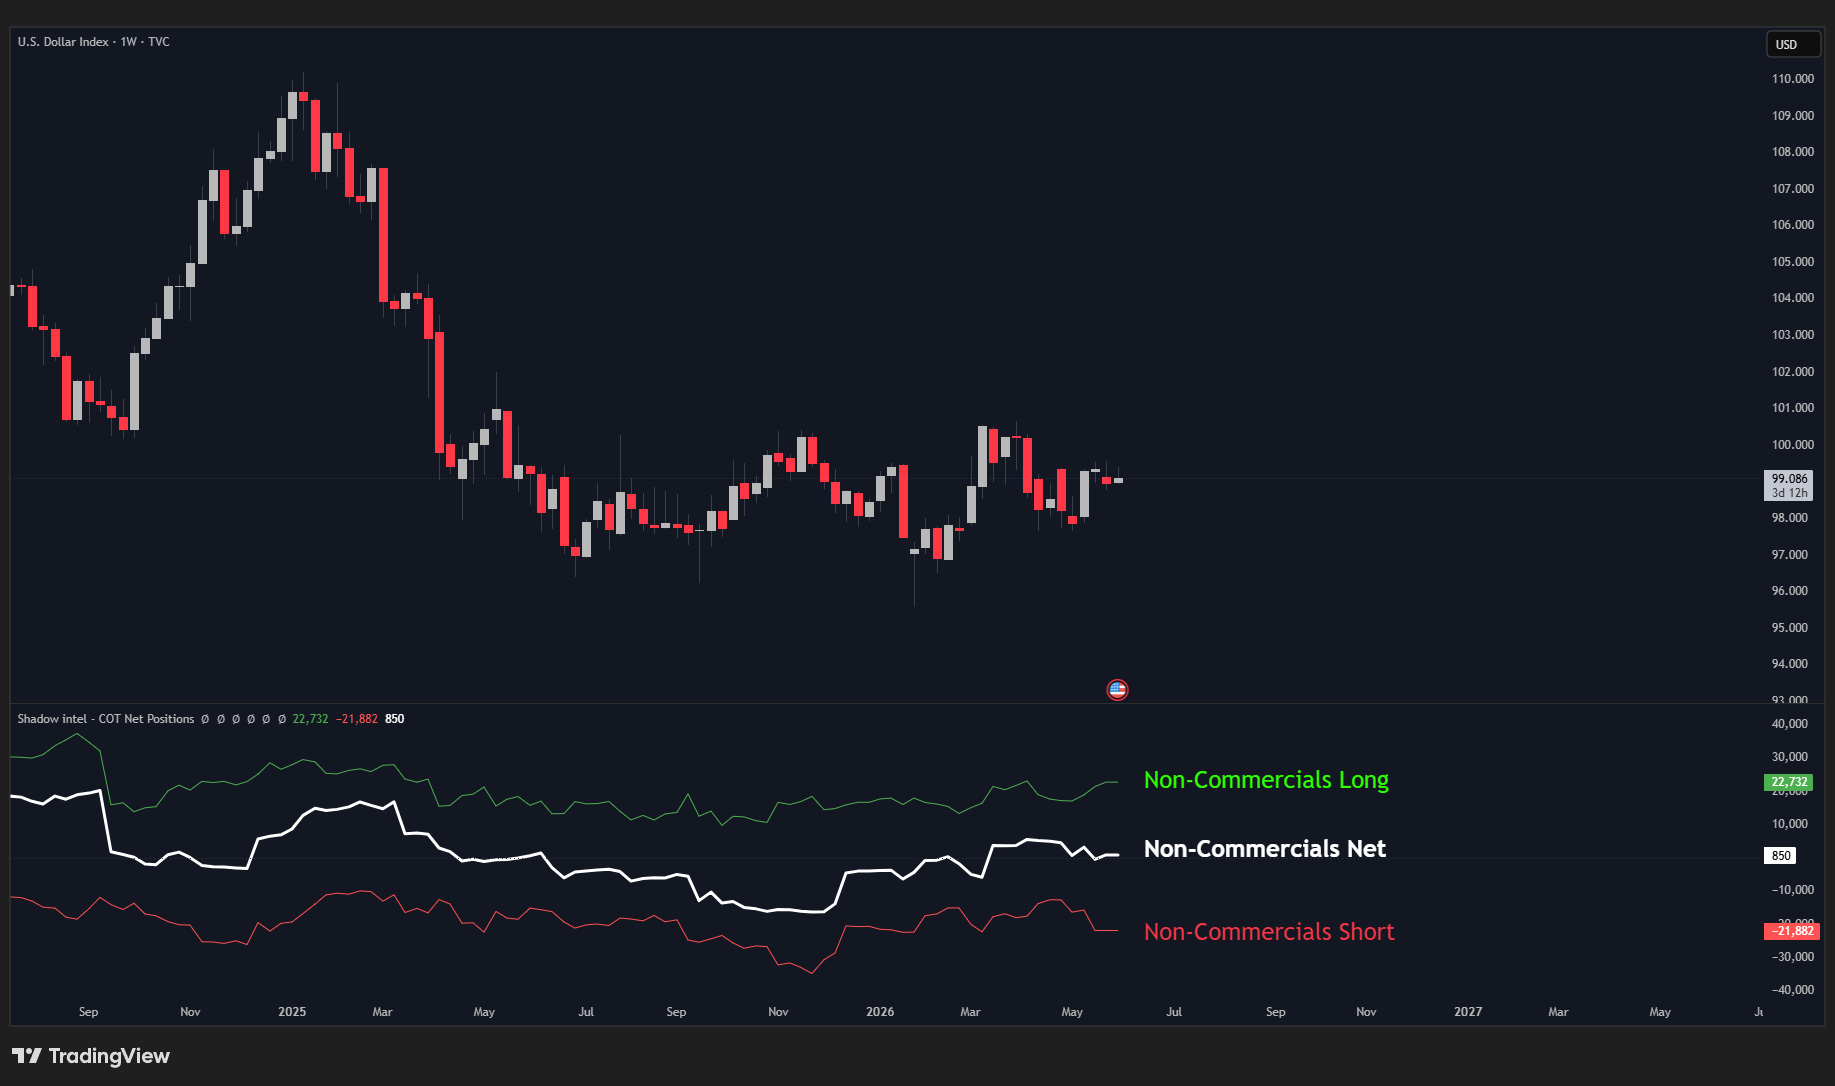
Large Speculators (Non-Commercials) The hedge funds and money managers. Trend followers by nature. When a move is in motion, they are in it.
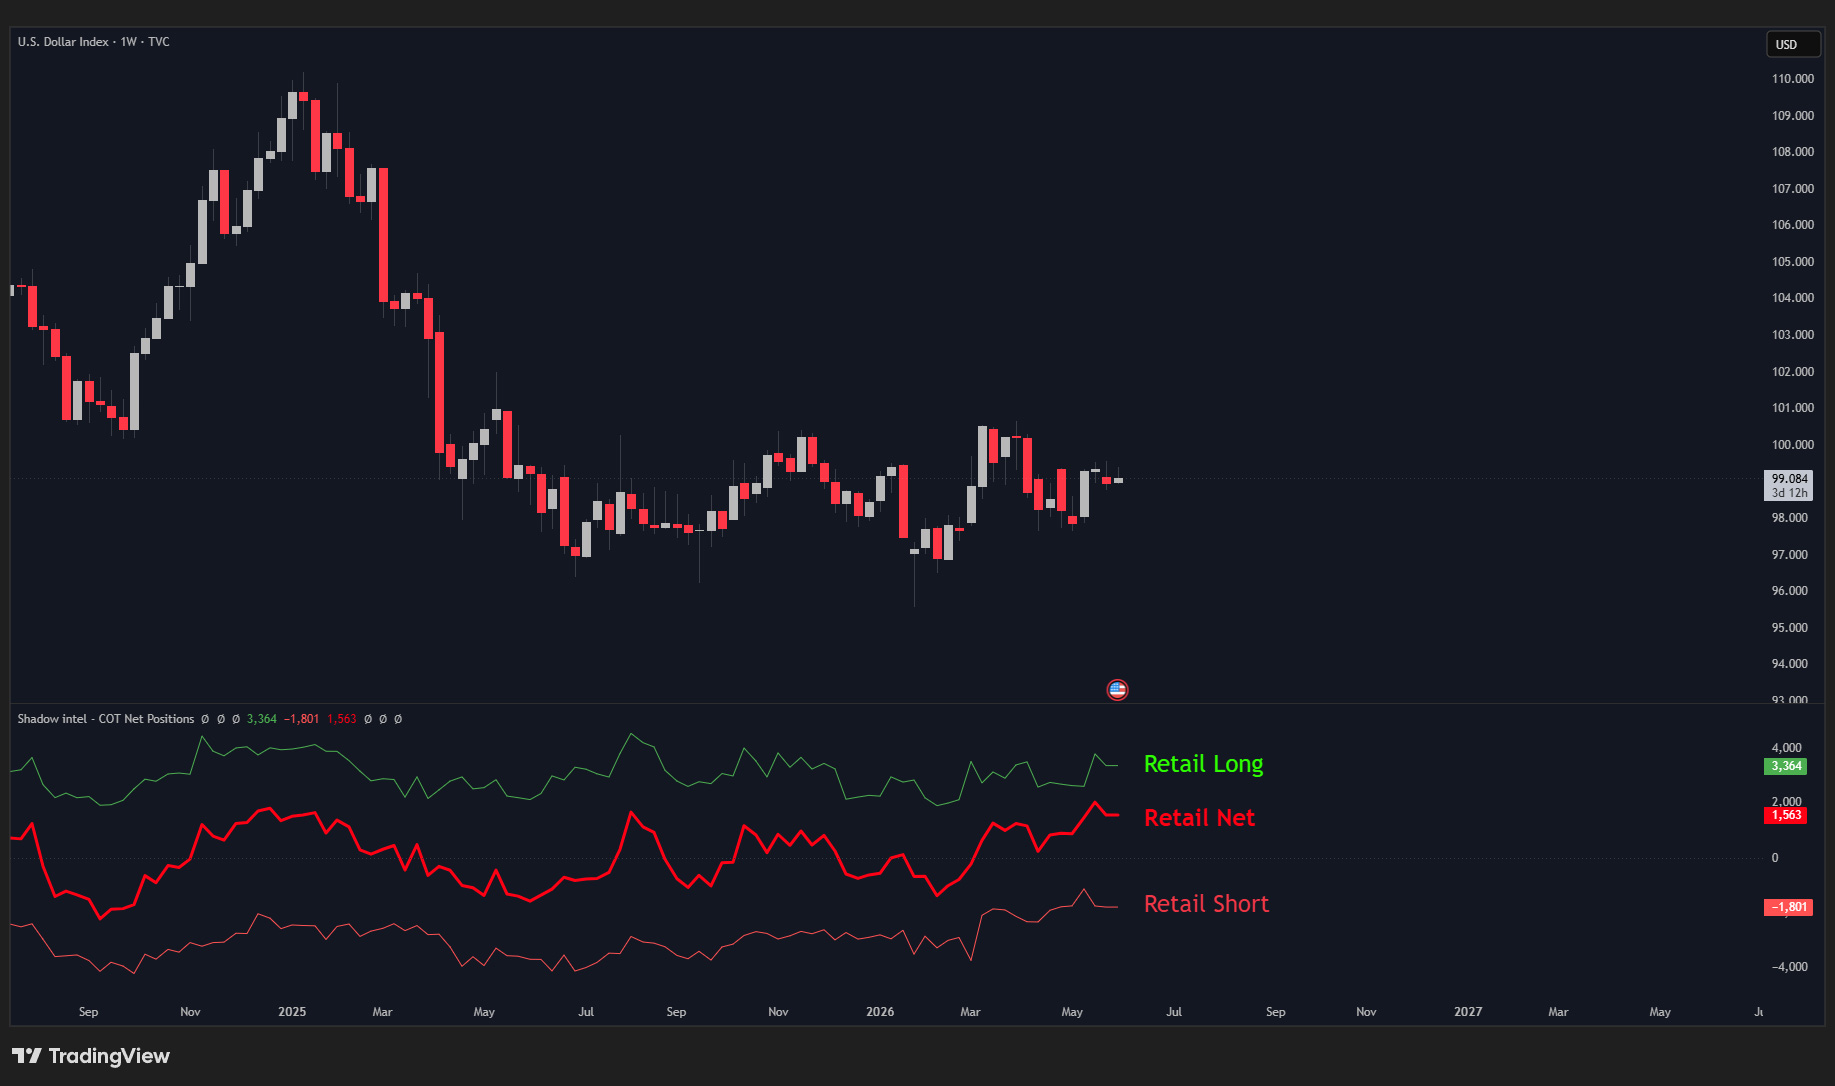
Small Speculators (Retail) Late to every move. The data will confirm this on almost every asset you look at.
// How to Read It
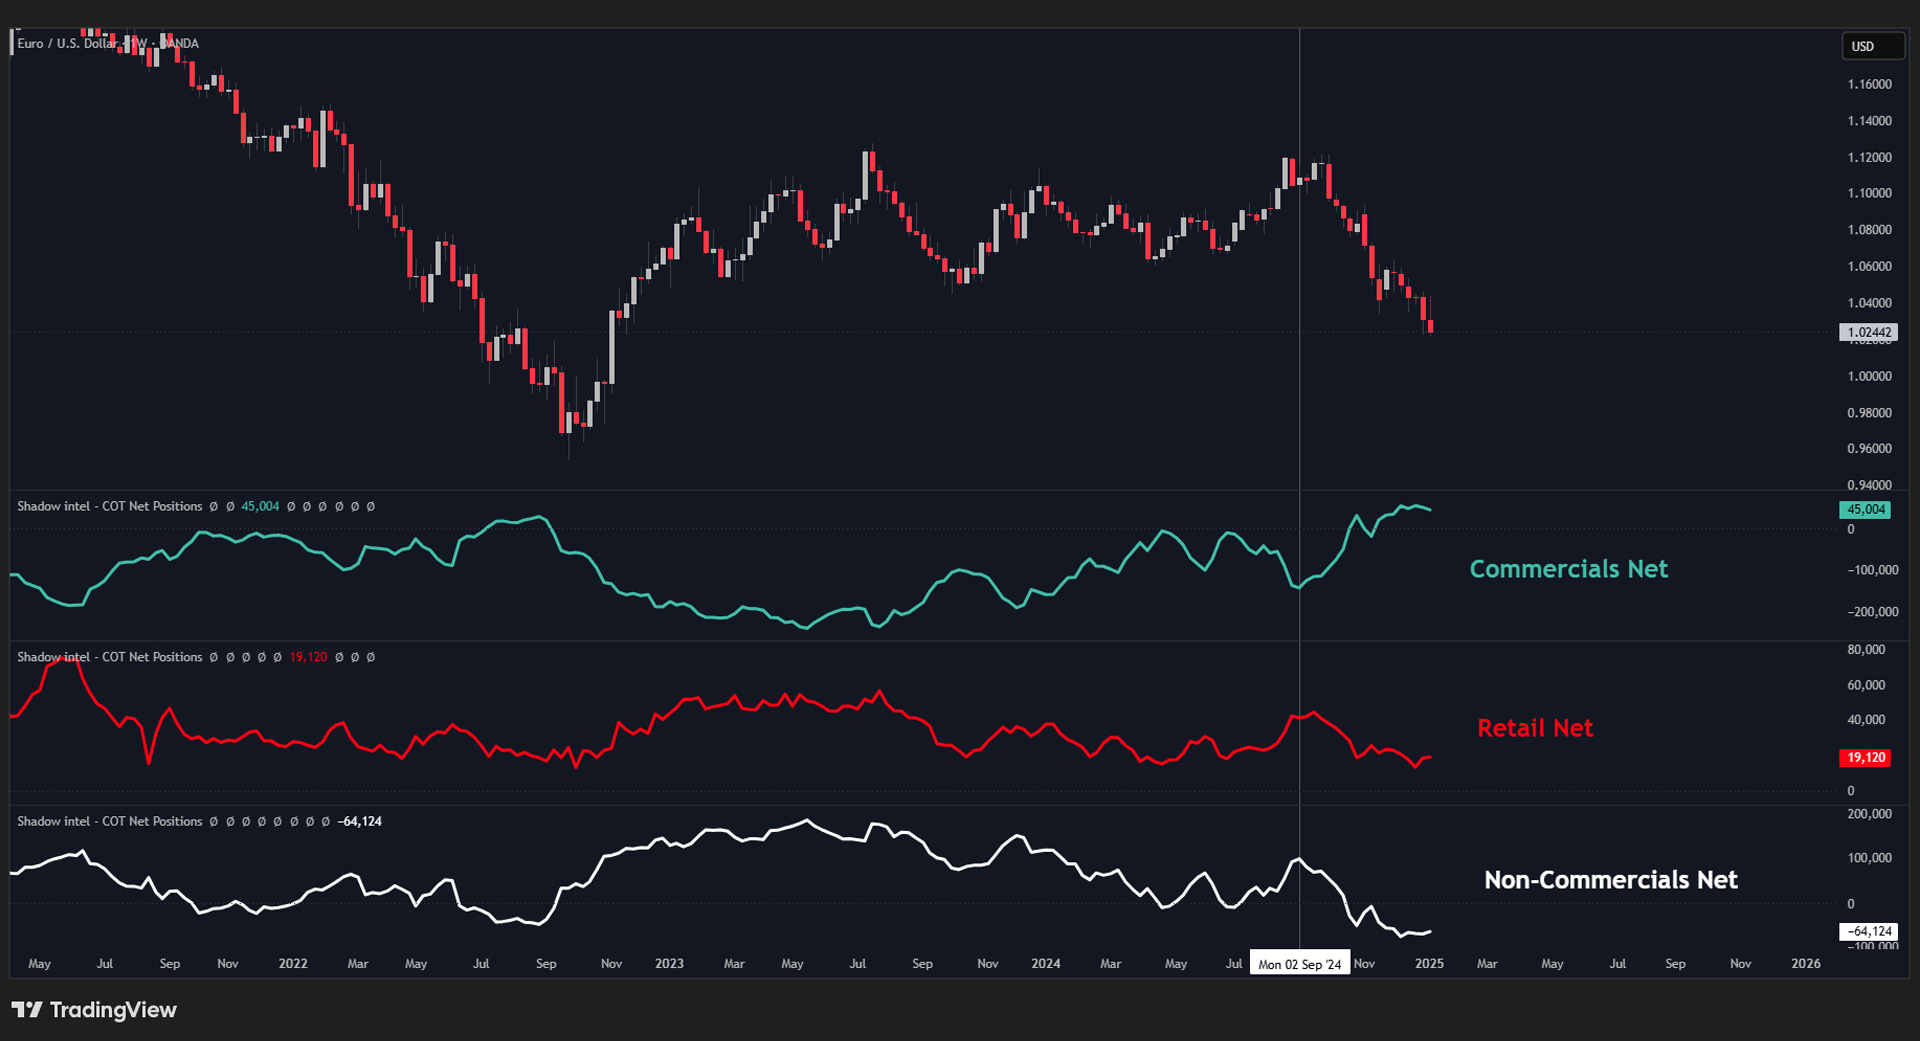
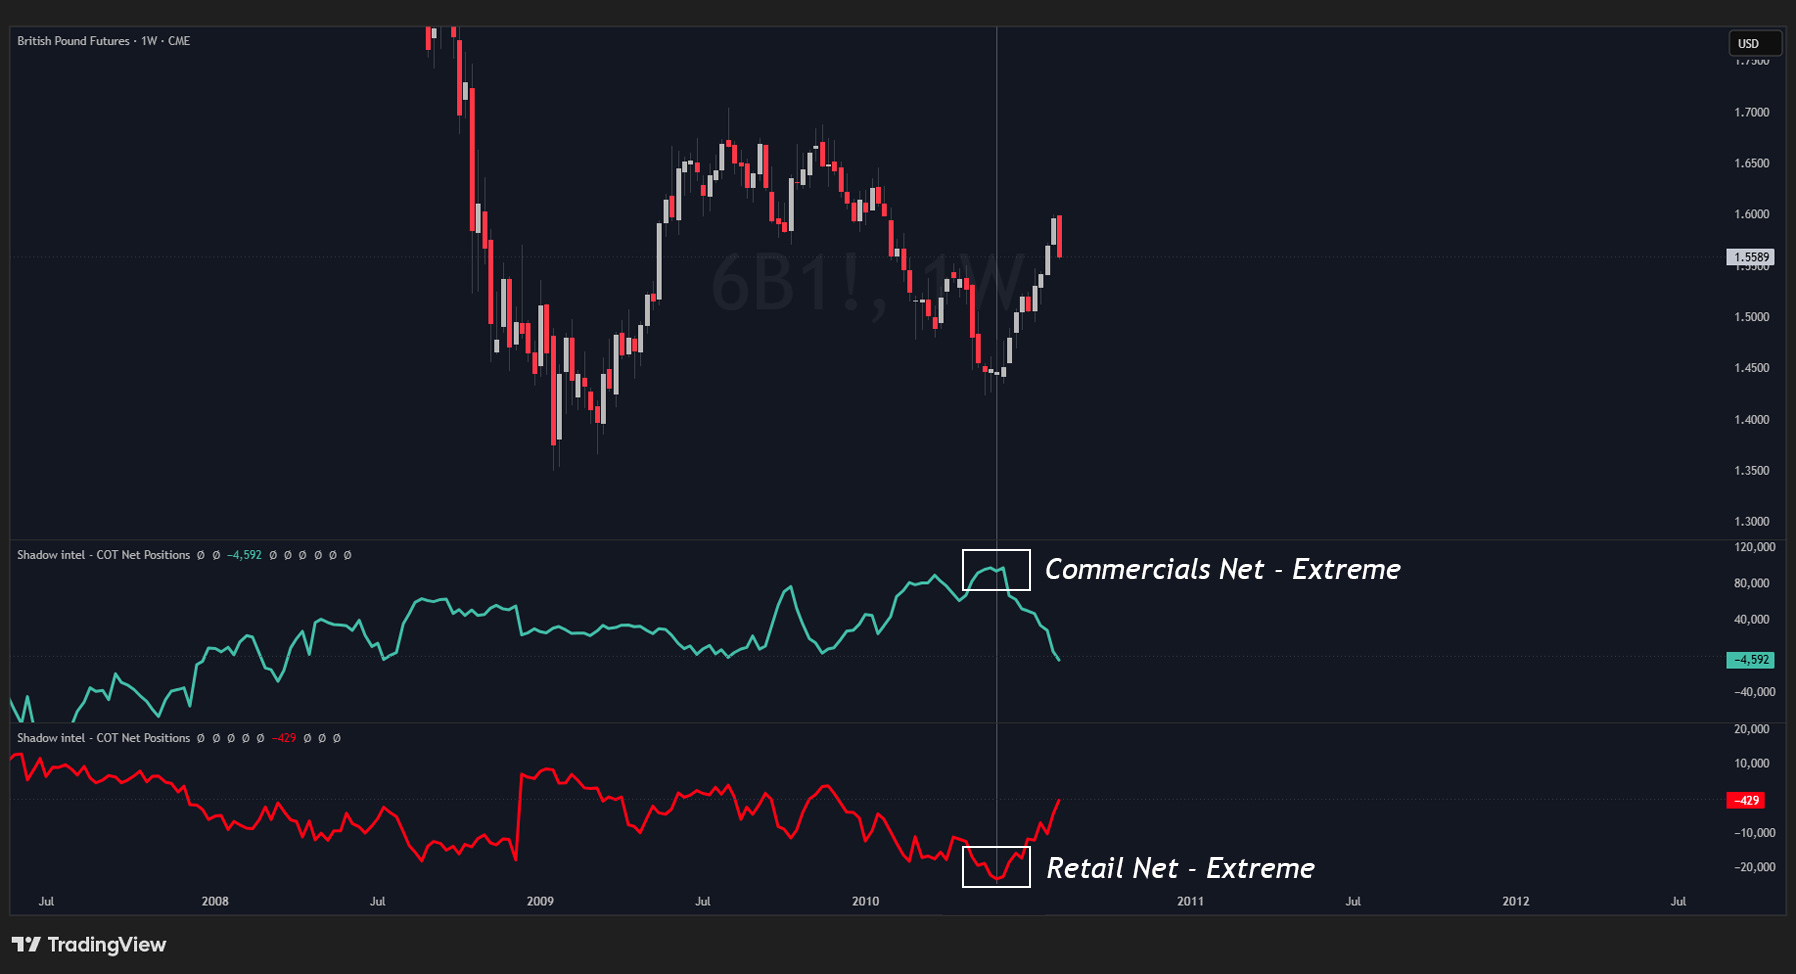
You are watching all three groups at once and looking for historical extremes.
When Commercials reach a bearish extreme, a reversal is likely approaching. When Retail is overexposed on one side — long or short — you already know what tends to happen next.
That is the edge. You are seeing the positioning before price reacts to it.
Important: This is not a timing tool. It does not tell you when to enter a trade. It tells you where the big money is positioned right now, relative to its history
Think of it as a high-timeframe macro confluence tool. When lines reach historical extremes or show accumulation and breakout patterns, that is when the asset deserves your full attention.
// Settings
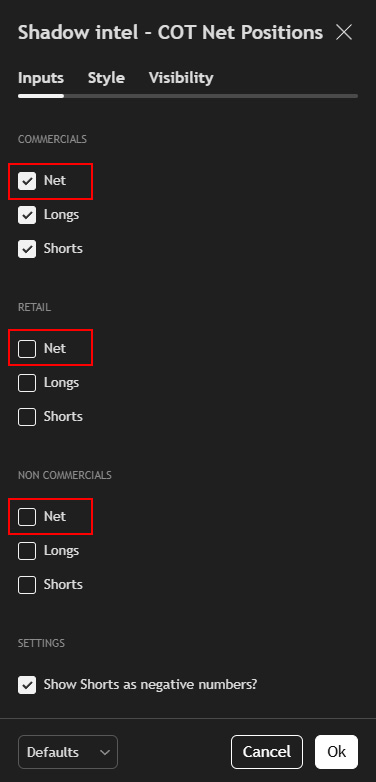
Show Commercials Net — Toggles the Commercials line on or off.
Show Retail Net — Toggles the Retail line on or off.
Show Non-Commercials Net — Toggles the Large Speculators line on or off.
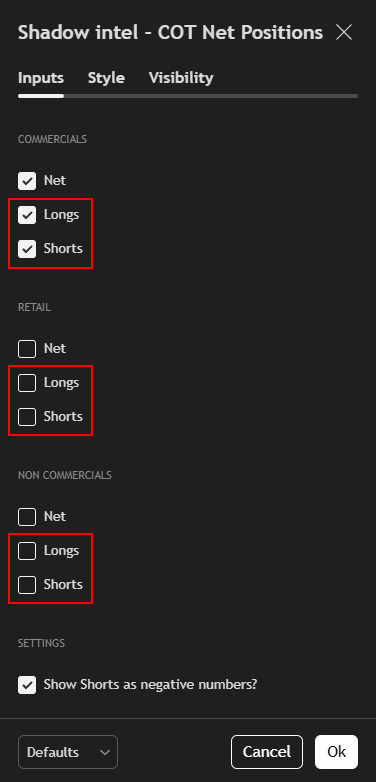
Show Longs — Toggles the Longs line on or off.
Show Shorts — Toggles the Shorts line on or off.
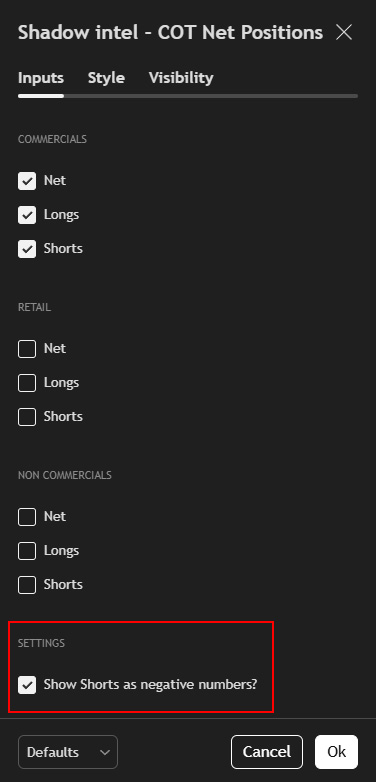
Show Shorts as negative numbers — Mirrors the Shorts line below the zero line for a clearer visual separation between long and short positioning.
Important: Use this indicator on the Weekly timeframe only. Always pair it with a Futures ticker, not a CFD.
// The Bigger Picture
This is the same COT data you already know — but now you can watch it move across 20+ years of history, directly on your chart.
Add Smart Money Extremes™ alongside it and you have the complete picture: raw numbers, visual net lines, and a normalized scale showing historical average extremes all at once.
Most retail traders never see any of this. Now you do.
For information on how to access this Shadow Intel Stack: